Supply Chain Control Tower for Retail Giant: How We Unlocked €2M+ in Hidden Inventory
This case delivered what defines operational excellence in retail: a single Supply Chain Control Tower that replaced five conflicting versions of reality with one governed source of truth. It uncovered over €2M in hidden inventory leakage and cut decision‑making cycles from weeks to days.
Executive Summary
A top European retailer (400+ stores, 20M online customers) was losing millions due to blind spots in its supply chain: inconsistent numbers, conflicting KPIs, and logistical bottlenecks no one could pinpoint.
We built a Supply Chain Control Tower - a single operational truth for more than 100 planners. For the first time, leadership could see the full lifecycle of every product: supplier → warehouse → store → customer.
Key Outcomes:
€2M+ in unnecessary inventory identified and corrected
Decision‑making cycle time reduced from weeks → days
100+ supply chain users operating on a single source of truth
80% reduction in Analysis Services load → faster, reliable reporting
Onboarding time cut from weeks → days
Client Profile and Context
The client operates 400+ physical stores and a significant online presence with 20 million customers, employing 4,000 people with 2,000+ using data platforms. The supply chain department consisted of 100 team members organized into specialized sub-teams (demand planning, stock optimization, supplier management), with 40 active Power BI users possessing advanced SQL skills and strong self-service capabilities.
Business Challenges
Decentralized Data Architecture and Logic
The supply chain team operated as a fully independent data island. Each sub‑team extracted its own ERP data, built its own logic, and maintained its own reports. The result: different numbers for the same KPI, no shared definitions, and no reliable view of where products were actually stuck.
No Single Source of Truth
Inventory levels, order statuses, and warehouse positions looked different depending on who was asked and which system they used. Critical knowledge lived in individual spreadsheets and in the heads of a few experts. Leadership couldn’t rely on any single version of the truth.
Complex Source System Environment
Data came from everywhere - ERP, an aging SQL server, local databases, bulk exports, Excel files - none of them aligned. The central warehouse platform existed, but no one trusted it. Reports broke easily, and uncovering operational bottlenecks was nearly impossible.
Inefficient Analysis Services Usage
The Azure Analysis Services model was slow, frequently outdated, and missing critical supply chain definitions. Users began downloading massive data volumes for local processing, a usage pattern that degraded performance for everyone while still not meeting their needs.
Limited Accessibility
Only 2-3 specialists per plant could access critical systems due to licensing constraints and technical complexity. When these individuals were unavailable, essential reporting simply stopped.
Solution Design
Astral Forest built a Supply Chain Control Tower consolidating all operational data into one consistent, governed, business‑owned source of truth.
Key principles:
Business‑owned definitions: one KPI, one meaning
Full lifecycle visibility: from supplier to warehouse to shelf
Cross‑team transparency: every decision maker sees the same reality
Self‑Service at scale: 100 people working from one shared model
To ensure a seamless transition, we introduced a Playground environment allowing teams to migrate without downtime or operational risk. This preserved continuity while building trust in the new model.
The results: The Control Tower revealed what leadership suspected but couldn’t prove: Most stockouts were caused internally, not by suppliers. For the first time, the team could distinguish:
items stuck in transit
items stuck in internal warehouses
items blocked by commerce rules
items missing due to operational errors
This insight alone unlocked over €2M in hidden inventory leakage and drove targeted process improvements across the entire supply chain network.
Implementation Approach
The transformation worked because the supply chain - not IT - owned the truth.
Business Domain Ownership
Each part of the supply chain (supplier orders, inventory accuracy, store replenishment) received clear end‑to‑end ownership.This ensured every domain delivered real operational value before the team moved to the next one.
Cross‑Functional Delivery
Instead of separating business and IT, we created one joint delivery group:
Business leaders made decisions on KPI definitions and logic.
Analysts and planners validated the data and the insights.
Our team ensured the new platform reflected real operational workflows.
This structure turned data quality from “someone else’s problem” into a leadership responsibility.
Full Transparency & No Disruption
All existing reporting continued to run throughout the transformation. There was no big‑bang switch, no downtime, and no risk to daily operations. Teams could compare old vs. new until they fully trusted the unified source of truth.
Key Challenges and Solutions
Retiring a Critical Legacy System Without Disrupting Operations: The legacy database was deeply embedded in daily processes. Removing it without breaking the business required a controlled, audited transition. We matched every use case with an improved alternative, validated each with the business, and only then retired the system.
Outcome: zero disruption, zero firefighting.
Fragmented Knowledge and Conflicting Definitions: Much of the company’s operational knowledge lived inside spreadsheets or in the heads of a handful of experts. Through structured sessions with supply chain teams and the ERP provider, this knowledge became formal, governed business logic.
Outcome: zero disruption, zero firefighting.
No Clear View of Where Products Were Stuck: Data from suppliers, warehouses, stores, and ERP systems didn’t align. By integrating all operational signals into a single lifecycle view, leadership could finally answer: “Is the issue at the supplier, in transit, in the warehouse, or in store operations?”This enabled targeted action instead of assumptions.
Outcome: stockout causes became measurable and solvable.
Five Sub‑Teams, Five Versions of Reality: Different groups used different KPI definitions, often contradicting one another. We facilitated alignment where possible and created transparent, documented variants where legitimate differences existed.
Outcome: collaboration replaced finger‑pointing.
Resistance to Change: Operational teams feared losing control and visibility. We demonstrated improvements using real business scenarios and allowed parallel usage of both systems until trust was built.
Outcome: fast adoption by 40+ advanced users.
Business Impact and Results
Operational Improvements
Report creation and decision cycles dropped from weeks to days.
New team members ramped up in days, not weeks, thanks to clarity and consistency.
100+ people now operate using the same single source of truth.
All power users moved to the new platform within six months.
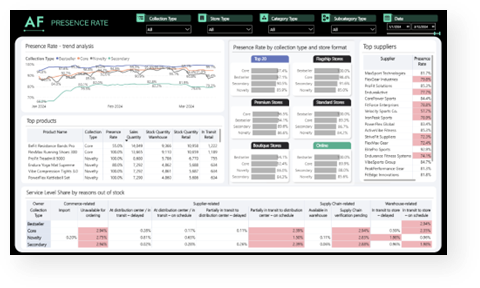
Advanced Analytics: The Presence Rate Example
The Presence Rate report became the executive dashboard that changed how leadership understood stockouts. It measured one critical question:
"Is the product physically available in the warehouse for the online order?"
This sounds simple. It's not. This single metric required stitching together data from ERP, WMS, e-commerce platforms, supplier delivery systems, and warehouse operations—data that had never been connected before.
The report categorized why products were out of stock across multiple dimensions:
Time-based trending: Identifying seasonal patterns and concerning degradations
Store-level analysis: Prioritizing top 20 stores by customer volume
Supplier performance: Revealing which suppliers consistently delivered expected inventory
Most powerfully, the report categorized why products were out of stock:
Commerce-related: Products unavailable for ordering or imports not yet in country
Supplier-related: Items in transit (on schedule, delayed, or partial delivery)
Supply chain internal: Products in warehouse but not delivered to stores
Warehouse operational: Process issues at distribution centers
Uncategorized: Cases requiring specific investigation
This revealed that most stockout problems were internal rather than supplier-caused - uncomfortable but actionable insight only possible because the team understood data models deeply enough to trace complet order lifecycles.
Presence Rate Raport
User Feedback
Supply chain team members consistently noted:
Writing SQL queries against star schema was easier than DAX formulas
Lower entry barrier for new members accelerated onboarding
Consistent naming across tables eliminated confusion
50+ Playground Schema objects (initially, decreasing over time)
20+ terabytes total data storage
Performance Improvements:
80% reduction in Analysis Services load
Report development: weeks → days
Query response: 30-60 seconds → 3-5 seconds
Daily refresh completion before 8 AM guaranteed
Adoption:
100+ supply chain members with access
40 active Power BI developers
200+ reports migrated within 6 months
90%+ user satisfaction post-implementation
Business Impact:
Single source of truth across all supply chain processes
Stockout root cause attribution enabling targeted improvements
Inventory optimization reducing costs while improving availability
New member onboarding: weeks → days
Conclusion
The Supply Chain Control Tower did more than unify data - it restored operational control across a complex retail network. For the first time, leadership could see exactly where products were getting stuck, why availability dropped, and how internal processes contributed to losses.
This clarity unlocked over €2M in hidden inventory leakage, reduced avoidable stockouts, and accelerated decision-making from weeks to days. But the most significant impact happened inside the organization. Teams stopped debating numbers and started solving problems. Planners, analysts, and managers aligned around one shared version of reality. Accountability became data-driven. Trust in reporting - lost over years - was rebuilt through transparency and consistent logic.
The Control Tower is now the operational backbone for the retailer’s supply chain. It supports daily decisions, powers strategic reviews, and provides the foundation for future AI-driven forecasting, optimization, and automation.
This transformation was not a technology upgrade. It was a structural shift that gave leadership full visibility, governance, and control over product availability - and the financial impact that comes with it.
We are here to answer your questions
Thank you! Your submission has been received!
Oops! Something went wrong while submitting the form.

%402x.svg)
.png)