Transforming Data Infrastructure: From 4.5 Hours to 15 Minutes
This case restored the one thing procurement cannot function without: trust in its numbers. A 30‑day audit exposed the root causes behind 4.5‑hour refreshes and conflicting KPIs, enabling a rebuild that cut refresh times to 15 minutes and visualization lag to under 3 seconds.
Executive Summary
A major telecommunications company's procurement department was hemorrhaging productivity and trust in their business intelligence system. Reports that should load in minutes took 4.5 hours. The same KPI showed different numbers in different reports. Users abandoned the BI platform entirely, reverting to manual Excel workflows and direct SAP queries, each person calculating figures differently, creating a maze of conflicting data.
Through a comprehensive month-long audit examining technical infrastructure, data visualization, and decision-making processes, we identified the root causes and delivered both immediate improvements and a long-term transformation roadmap. The result: procurement teams gained a single source of truth, report refresh times dropped from 4.5 hours to 15 minutes, and visualization rendering improved from 40 seconds to under 3 seconds.
About the Client
Our client is a major telecommunications company operating in Poland. We partnered with their procurement division, a critical function responsible for everything from securing steel and materials for transmission tower construction to managing supplier relationships worth millions of euros across the organization.
In telecommunications, procurement isn't a back-office support function. It's strategic. Supply chain delays on steel or fiber optics can postpone network expansion. Poor pricing intelligence can erode margins on multi-million euro contracts. Procurement decisions ripple through every business unit, affecting revenue, customer experience, and competitive positioning.
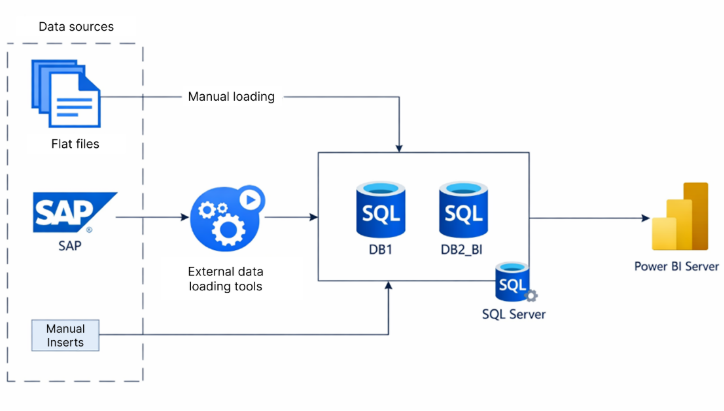
The procurement team employed approximately 12 managers, each leading their own buying teams. Despite having invested in a BI infrastructure built on SQL Server and Power BI, the system had degraded to the point of being worse than useless, it actively undermined their work.
The Challenges
4.5 Hours: The Cost of Paralysis
Data refreshes that should complete in 10-15 minutes took 4.5 hours, making frequent updates impossible. Steel pricing reports that buyers needed for daily negotiations were often one to two months out of date. When market prices shifted, their intelligence didn't - leaving them negotiating blind.
Multiply this across dozens of daily decisions: vendor selection, contract renewals, volume commitments, pricing negotiations. Each four-and-a-half-hour delay translates directly into missed opportunities, weaker negotiating positions, and unfavorable terms.
The Trust Collapse
When the same procurement KPI shows different values in different reports, you don't have a technical problem, you have an organizational crisis. Ask three departments about the same metric, get three different answers. Even within procurement itself, reports contradicted each other.
The buyers abandoned the BI system and returned to manual workarounds: direct SAP queries, personal Excel spreadsheets, individual calculations. Each person applied their own filters and logic. Two colleagues pulling "the same data" would get different results because they approached it differently.
Performance: When Every Click Costs 40 Seconds
Users faced 30-40 seconds of lag every time they clicked a filter or changed a visualization parameter.
In telecommunications procurement, analysis isn't linear. You're comparing vendor pricing across regions, examining volume trends across product categories, analyzing delivery performance by quarter. Each question spawns three more questions. Good BI enables rapid exploration - hypothesis, filter, check result, refine, repeat.
Technical Debt Compounding
Behind the scenes, the technical situation was dire:
20,000 lines of code in a single fact table - something that should require 3,000-4,000 lines with proper implementation
Each year's data loaded separately rather than through a single parameterized process
SQL Server 2012 running without support - any critical failure would require scrambling to find external consultants and paying emergency rates
No development, testing, or production environments; everything mixed in one chaotic system
Zero documentation explaining why transformations existed or who requested them
One director once requested a change in the calculation formula for supplier lead time variance. Someone implemented it. The director left the company. Nobody documented why the formula was changed or whether the new calculation still mattered, but there it remained in the code, unexplained and unmaintained, cluttering the system
The Process Void
Decision-making about BI development happened in a vacuum. Business users would meet to prioritize requirements, 10 things to build, but no technical representative attended. Nobody could tell them that Item #1 would take 3 days while Item #7 would consume 6 months.
Twelve managers each brought their own requirements without coordination. Nobody connected the dots- that requirements overlapped, that building one required first completing another, that solving them together would be more efficient than solving them separately
The Solution
The Audit: Diagnosing Before Prescribing
We deployed a data engineer/architect and a Power BI developer for an intensive 30-day diagnostic across three critical dimensions. This wasn't about generating a report that would sit on a shelf. This was about understanding the full scope of the problem so we could build something that would actually work.
Infrastructure Autopsy We went deep into their SQL Server environment, examining views, queries, and data transformation logic. We documented not just what existed but how it got there - tracing the evolution of that 20,000-line fact table, identifying where transformations should happen (database) versus where they were happening (Power BI), and mapping the dependencies that nobody had documented.
Power BI Forensics We dissected their reporting layer: data models containing 1,100 columns where 699 (64%) were completely unused, DAX measures performing complex dynamic calculations that should be static, page designs with zero consistency, and user workflows that forced people to fight the interface instead of finding answers.
Process Archaeology We interviewed business users - not just asking what they needed but helping them articulate needs they couldn't express. We studied their decision-making, their prioritization, their governance. We found a procurement team that had forgotten what good BI looked like because they'd never experienced it.
Immediate Wins: Stopping the Bleeding
Before tackling the fundamental rebuild, we identified changes that could deliver relief immediately:
Standardize the user experience. Create consistent report layouts so users spend cognitive energy on analysis, not figuring out where to click. Remove visual friction.
Delete the cruft. Hundreds of unused columns, abandoned tables, and outdated visualizations were slowing performance. Remove them. Every element that remains should justify its existence.
Move transformations where they belong. Heavy calculations happening in Power BI during user interactions should happen in SQL Server during data refresh. Push computation away from the user-facing layer.
Document what exists and why. Start building institutional memory so the next developer doesn't spend three hours reverse-engineering what the last developer built.
Long-Term Transformation Roadmap
The audit uncovered the scope of what was needed. The next phase would actually do it: 279 days of systematic reconstruction.
But here's what made this different: we weren't just delivering a new system. We were building their capability to maintain it.
Knowledge Transfer Through Partnership The procurement team would assign technical resources to work alongside our experts. We'd demonstrate best practices, explain decisions, and gradually shift responsibility. Initially, we'd carry most of the workload while they learned. Over time, they'd take on more development while we provided oversight and guidance.
Recommended Organizational Structure We outlined the roles they needed:
Someone to maintain the high-level view, understanding all requirements and filtering priorities
A technical advisor to evaluate feasibility, estimate timelines, and recommend architectural approaches
Data engineers to handle transformations at the database level
Power BI developers to build visualizations and data models
Modern Infrastructure Migration We planned migration from SQL Server 2012 on-premises to Google Cloud Platform, and from Power BI Report Server to Power BI Service, eliminating support gaps and enabling modern capabilities.
Results Achieved
Performance: From Impossible to Invisible
Report refresh time: 4.5 hours → 15 minutes (96% improvement) Buyers can now get current data during the same negotiation cycle, not half a day later. Morning requests complete before lunch. Analysis that was impossible becomes routine.
Visualization response: 30-40 seconds → under 3 seconds (90%+ improvement) Users can explore data naturally - question, filter, check, refine - without losing their train of thought in endless loading delays. The system finally gets out of their way.
Code efficiency: 20,000 lines → 3,000-4,000 lines Maintenance burden collapses. Changes happen once instead of being hunted through thousands of lines. New developers can understand the system instead of drowning in complexity.
Data model: chaotic tables → 12 fact tables and 60 dimensions
We transformed a chaotic collection of tables into a semantic model with unidirectional relationships following Microsoft's best practices for tabular models. Structure that can scale instead of collapse.
Audit as "Moment Zero": How 30 Days Built the Foundation for a Multi-Year Partnership
The 30-day audit was far more than a technical assessment- it was the first chapter of our shared history with the client. This was the moment we transitioned from being viewed as a "vendor" to becoming a Trusted Advisor, taking full ownership of the business outcome from day one.
The audit provided the Board with something more valuable than a list of technical flaws: it gave them clarity and a sense of control. For the first time, they had a realistic roadmap from where they were to where they needed to be. It was this transparency that convinced them to stop the cycle of endless, ineffective "patching" and commit to 279 days of systematic reconstruction with Astral Forest.
We are here to answer your questions
Thank you! Your submission has been received!
Oops! Something went wrong while submitting the form.

%402x.svg)