One Ledger for 324 Entities: How a Professional Services Group Closes Four Days Faster
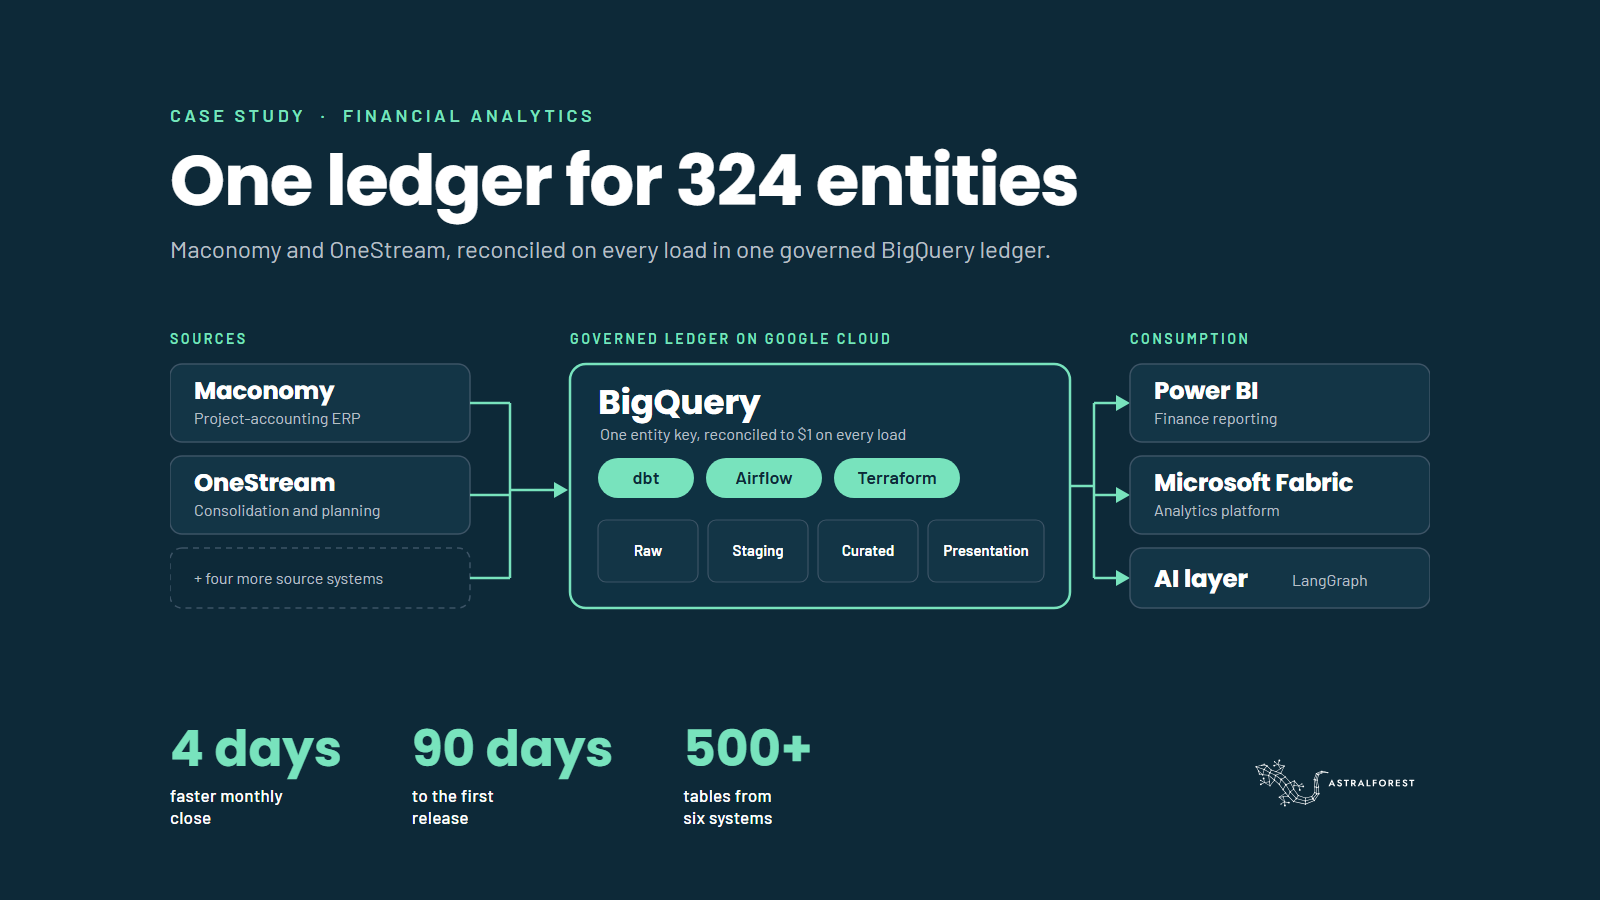
This case study shows how a global professional services group put one governed ledger on BigQuery between its Maconomy project-accounting ERP and its OneStream group planning platform. First release in 90 days, full production in six months. The monthly close now runs four days faster, reconciliation runs on every load, and the platform became the working base for a receivables and work-in-progress programme that released $57M of cash.
Executive Summary
A global professional services group runs its business through a network of agencies: 324 active legal entities, 207 of them billing through the ERP. Its project-accounting ERP, Maconomy, and its group planning platform, OneStream, which produces the group financial statements, reported two different sets of numbers. The difference was reconciled by hand, every month, in spreadsheets.
We built one governed ledger on BigQuery between the two systems. The first release went live in 90 days and the full platform reached production in six months, built to SOX requirements from day one.
Key Outcomes
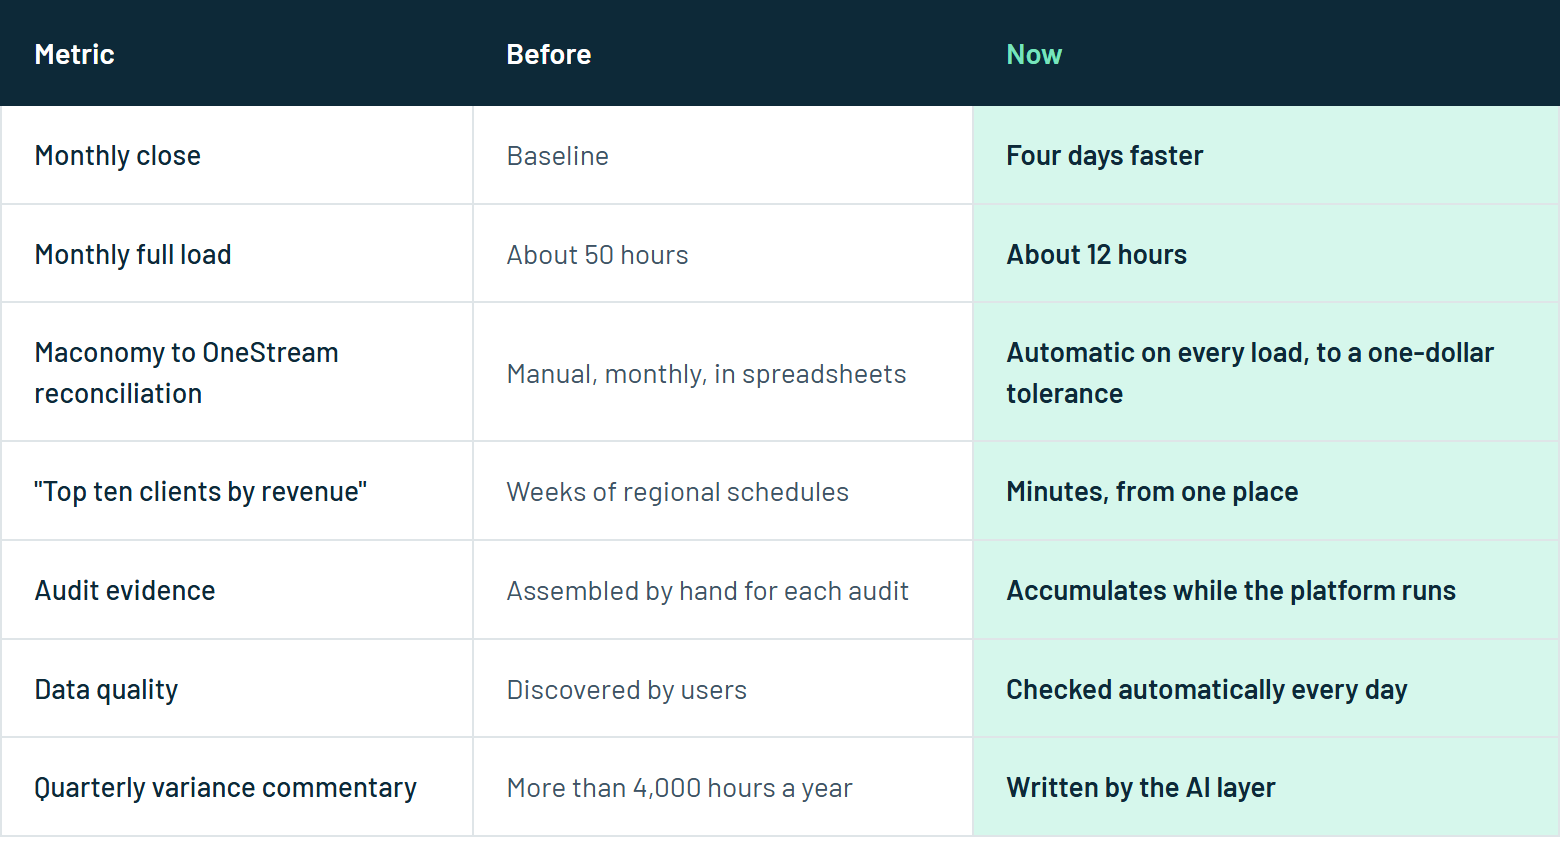
The monthly close runs four days faster. The reporting pack leaves finance earlier, because the numbers arrive already reconciled.
Reconciliation became a control. Maconomy and OneStream reconcile on every load, to a one-dollar tolerance, and every difference comes back flagged with its source.
$57M of cash released. The platform became the working base for an accounts receivable and work-in-progress programme. How we count this is set out under Results.
The monthly full load fell from about 50 hours to about 12.
"Which ten clients generate the most revenue?" takes minutes. It used to take weeks of schedules from the regions.
Audit evidence accumulates while the platform runs, and an AI layer on top now writes the variance commentary that used to consume more than 4,000 hours a year.
The Challenge
The group grew through acquisitions. Each agency is a separate legal entity with its own reporting, inside a ten-level hierarchy that nobody drew on purpose.
Two systems, two stories. Maconomy said one thing and OneStream said another. Reconciling them was redone by hand every month, and the effort grew with every acquisition.
Ordinary questions had no answer. Which ten clients generate the most revenue. How much the group spends with one vendor across all of its countries. How much cash is locked up, and where. Each meant collecting schedules from the regions, took weeks, and arrived in a form nobody could defend.
Every team kept its own copy. Extracts left both systems every month, one per team, per copy, per version of the truth.
Audit evidence was a project. It was assembled by hand for each audit, and the SOX obligations did not wait for the data to be tidy.
The Solution
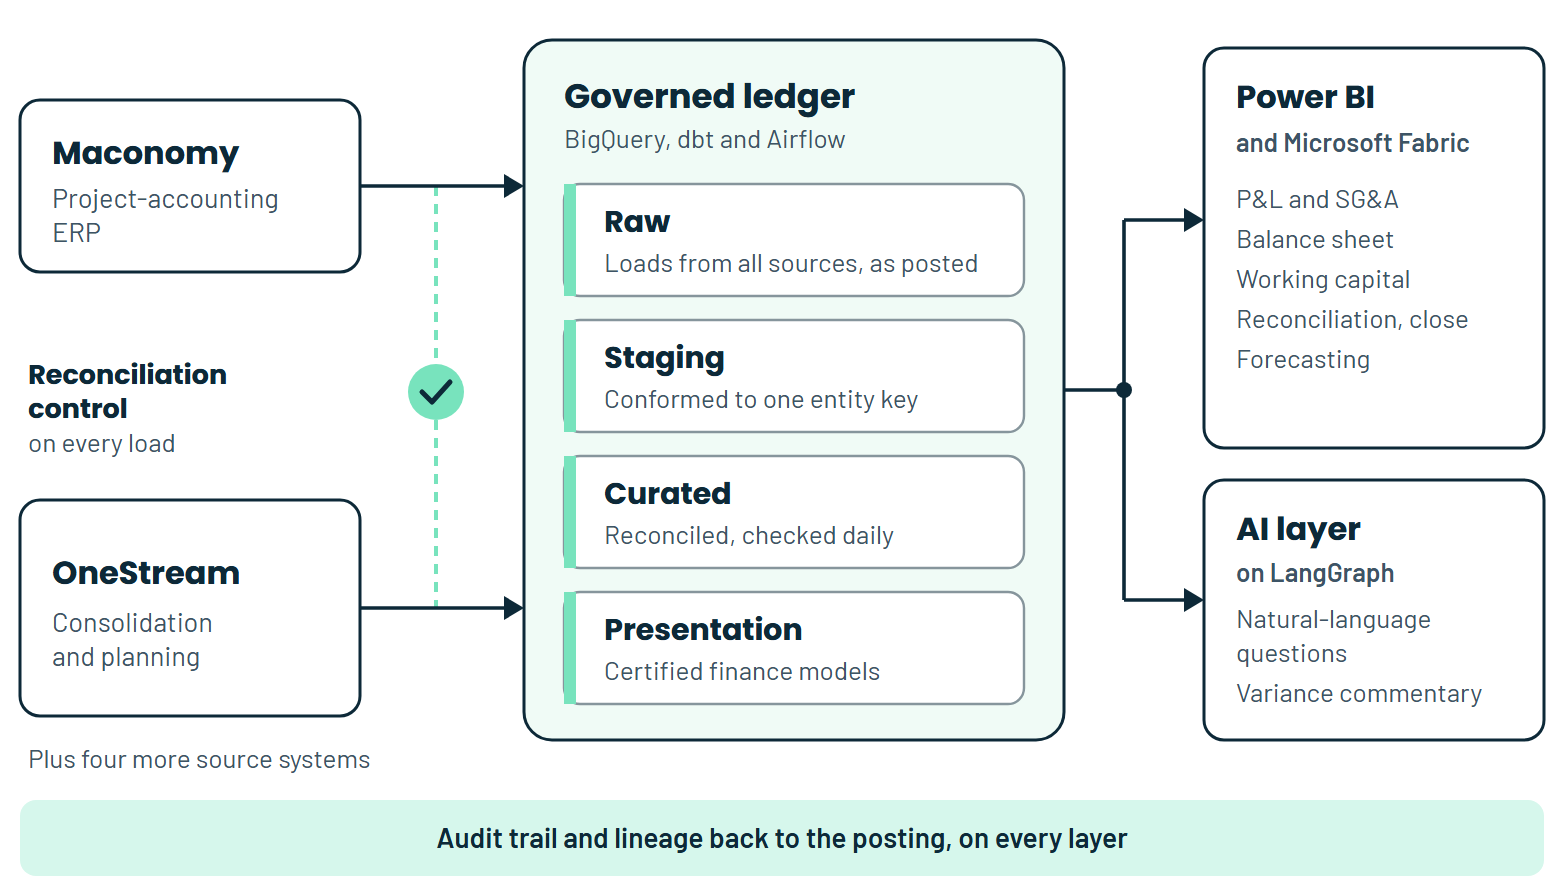
One general ledger for the whole group. Maconomy and OneStream share a single entity key and reconcile automatically, to a one-dollar tolerance. Every difference returns to the warehouse as a flagged adjustment, so finance sees how much is out and where it came from. Intercompany eliminations are computed up the full hierarchy on every load.
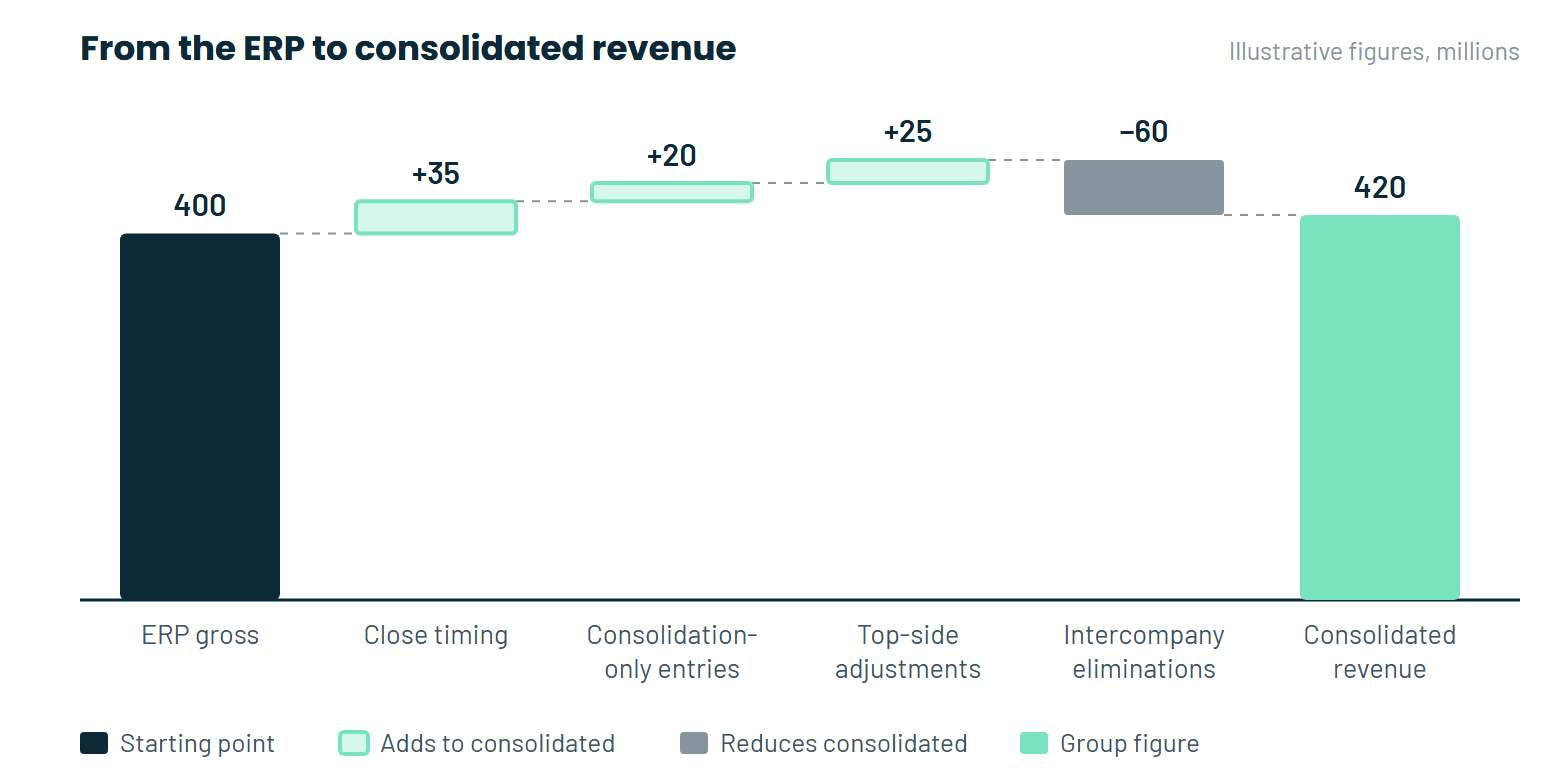
The bridge, leg by leg. The gap between ERP revenue and consolidated revenue is broken into named legs: close timing, entries that exist only at group level, top-side adjustments and intercompany eliminations. Each leg is a reconciling difference with a source, which is what a controller needs before signing.
The same number everywhere. The figure in Power BI, the figure in the report that gets signed and the figure in Excel are one figure. Excel stayed. What changed is where it reads from.
Governed layers, checked daily. Loads from all six source systems land as posted and move through four layers: raw, staging, curated and presentation. Along the way they are conformed to the one entity key and published as certified finance models. Automated checks run every day, and every step leaves an audit trail.
The AI layer, last. Once the ledger was trusted, an AI layer went on top. Codified variance playbooks, orchestrated with LangGraph, retrieve the data, translate the numbers into business context and write the quarterly variance commentary. Every model call and every rule decision is logged for the SOX audit trail.
The stack. Maconomy, OneStream and four more source systems feed BigQuery on Google Cloud, with the infrastructure defined in Terraform. dbt builds the models, and Airflow on Cloud Composer orchestrates the loads. Reporting runs on Power BI and Microsoft Fabric. The AI layer runs on LangGraph.
How We Built It
The first release went live in 90 days. Full production followed at six months. The pace came from removing what usually slows these programmes down.
Environments are created from code. The Google Cloud infrastructure is defined in Terraform, so a new environment is a command away.
One deployment pipeline for every change. Developers do not deploy by hand, and changes move through development, test and production the same way each time.
Documentation is generated by the build. The data catalogue and column-level lineage come out of the same process that builds the models.
Identity was settled on day one. Access is federated, with no stored secrets, which took the usual weeks of security back-and-forth off the plan.
Scope started where the numbers are. The build began with the source tables that carry the reported figures, and grew to more than 500 tables across six systems.
Results
The monthly close runs four days faster. The reporting pack leaves finance earlier every month, because the numbers arrive already reconciled.
$57M of cash released. The warehouse became the working base for an accounts receivable and work-in-progress acceleration programme. It showed which invoices were worth chasing, and the programme put $57M of cash back in play.
How we count this. The $57M is the delivered outcome of the accounts receivable and work-in-progress programme that ran on the warehouse. The warehouse made the cash visible and chaseable; the programme collected it. We attribute it the way the client's finance team does.
A platform that keeps paying. On the governed layer sits a catalogue of 26 finance use cases, from intercompany matching to a 13-week cash flow view. Each one is a small project with its own business case.
What We Learned
SOX turned OneStream data retrieval into a proof. We had to prove that the data we retrieved from OneStream was the same data OneStream held. Because of OneStream's limitations, that proof had to be statistical, and we built it to a standard that satisfied the SOX criteria.
Sequence decides whether it works. One ledger first, then cash, then AI. The working-capital programme needed numbers finance would defend, and the AI layer needed a ledger it could trust. In the opposite order, both would have been built on the same disputed figures.
Start where the numbers are. Beginning with the tables that carry the reported figures kept the first release small enough to ship in 90 days. Everything else could follow once the core reconciled.
The strategic lesson: a finance data programme earns trust by reconciling before it reports. Everything valuable built on top, cash and AI included, depends on that first step.
%402x.svg)