Five Allocation Processes to One: How a Manufacturing Group Rebuilt Finance Reporting After an Acquisition
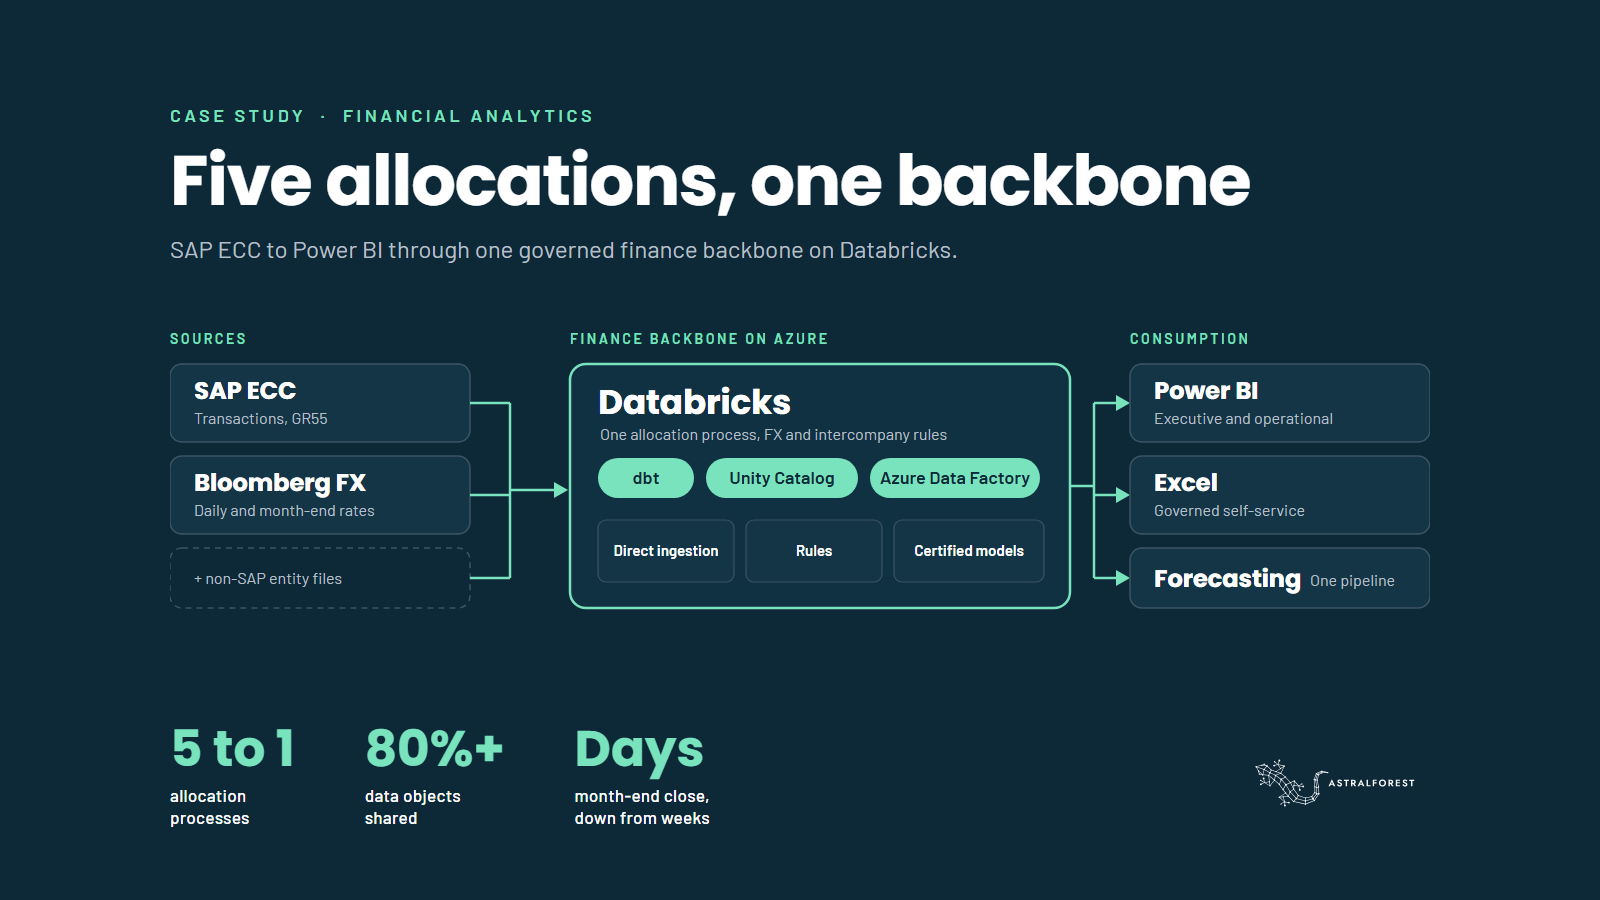
This case study shows how a global manufacturing group, after a major acquisition, replaced five allocation processes, a manual SAP BI and BPC to Excel to Power BI relay and regional forecasting spreadsheets with one governed finance backbone on its Databricks platform. Month-end moves from weeks to days, more than 80% of data objects are shared across reporting domains, and certified Power BI models replace shadow reporting.
Executive Summary
A global manufacturing group had just closed a major acquisition. Its finance function now ran two reporting realities side by side, with different cost structures, different profitability models, multiple ERP instances, and a long tail of spreadsheets and Access databases holding the logic in between. Every month the numbers were made to agree by hand.
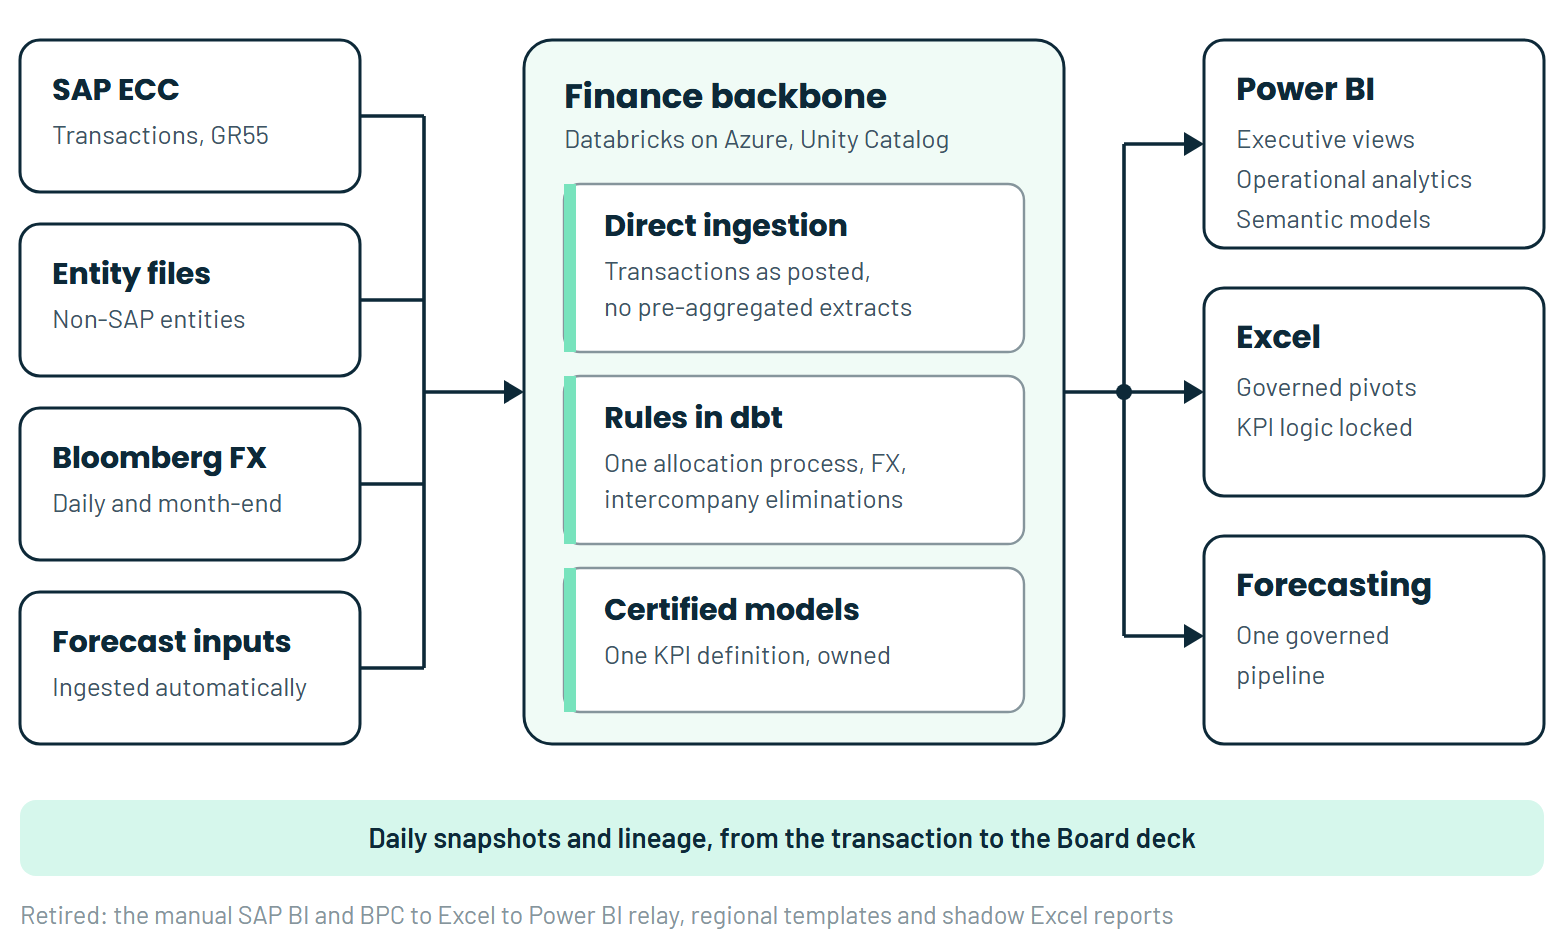
We designed one governed finance backbone for the combined group, on the Databricks platform it already runs on Azure: direct ingestion from SAP ECC, one set of KPI definitions and hierarchies, one allocation process, and certified Power BI semantic models for executives, operational teams and Excel users.
Key Outcomes
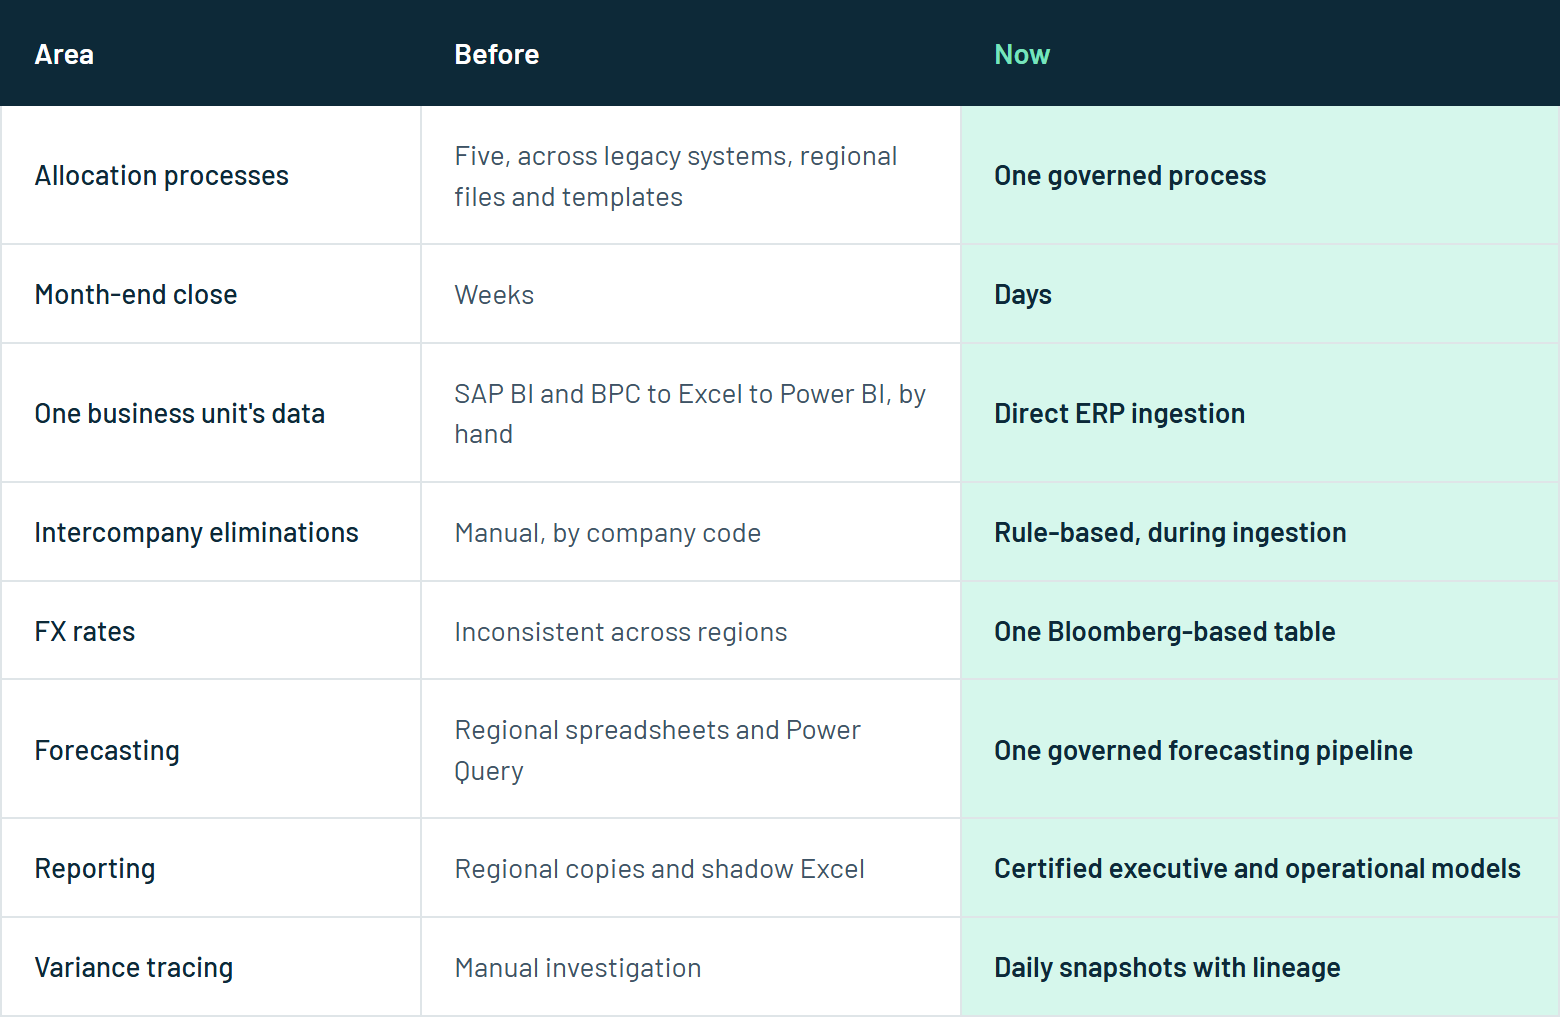
Five allocation processes consolidated into one. Month-end no longer depends on individual people and their files.
Month-end from weeks to days. Automated GR55 onboarding and direct ERP ingestion replace manual templates and offline reconciliations.
More than 80% of data objects shared across reporting domains, so each new report builds on what already exists.
Forecasting standardised and automated. Regional templates and Power Query consolidations give way to one governed forecasting pipeline.
Shadow reporting retired. Certified executive and operational models replace the regional copies.
One FX repository for the group, Bloomberg-based, behind every reporting currency.
The Challenge
The acquisition brought two finance models under one roof, and neither fitted the other.
No single source of truth. Legacy reporting platforms, local flat-file processes, Access-based SG&A repositories and a separate consolidation submission all produced numbers, and they disagreed with each other. Differences were closed with manual adjustment lines each month, so finance kept reconciling symptoms while the sources stayed wrong.
Five allocation processes and no owner. Allocation logic lived in legacy systems, regional files and local templates. Month-end stability rested on personal knowledge and manual interventions.
Logic without custodians. The legacy reporting platform had been built years earlier by people who had since left. Its documentation could not be trusted, and much of the KPI and allocation logic could only be understood by reverse engineering it.
A monthly relay for one business unit. Its data moved from manual SAP extractions to manual transformations, then through Excel, then into BI. Sales volumes from different ERP sources did not reconcile, so "dummy" lines were added to force a match. The workaround had become the process.
BI that nobody used. Users exported raw extracts, joined them with offline mappings and rebuilt dashboards in Excel. Each region kept its own version of the same report, with its own definitions.
The Solution
One backbone, many outputs. The planned reporting projects all drew on the same sources and the same transformation logic. Building them separately would have duplicated an estimated 65 to 80% of the effort and locked the inconsistencies in. The design puts one governed foundation underneath every report and every forecast.
Built on the platform the group already runs. The backbone sits on the group's Databricks platform on Azure. Finance models are built as dbt transformations, governed in Unity Catalog, loaded through Azure Data Factory and read through Power BI semantic models. We build the finance data products on that platform, alongside the team that runs it.
Month-end, P&L and forecasting, automated. Direct ingestion from SAP ECC replaces manual extracts and offline templates. FX is applied automatically, daily and at month-end, from one Bloomberg-based rate table. Intercompany eliminations run as rules during ingestion, in place of manual company-code eliminations. Daily snapshots make every variance traceable to the movement behind it.
One definition of performance. A single model holds the KPI logic, P&L structures, hierarchies, ownership and access. Certified datasets replace local versions, and role-based controls stop metrics drifting between regions. Finance and Data share accountability for it.
Two reporting layers, one source. Executives get simplified, comparable, export-ready views. Operational teams get drill-down analytics across products, customers and regions. Both read the same certified Power BI semantic model, so leadership and the teams work from one story.
Excel, governed. Finance teams keep their Excel pivots, now connected to the governed semantic model. They can slice the data any way they need, and the KPI logic stays locked.
How We Built It
The engagement opened with a deep analytical phase. It produced a decision-ready blueprint with sequenced delivery options, risk-weighted trade-offs and one shared data model for every reporting workstream.
Business alignment first. We identified the finance processes causing the most risk and delay: cost structure, P&L logic, the forecasting workflow and profitability reporting.
One foundation, sequenced. Delivery is ordered around the shared data foundation, starting with the management reporting layer, whose data objects every other domain reuses.
Logic recovered, then governed. Undocumented allocation and KPI rules are reconstructed and rebuilt as version-controlled dbt transformations, each with a named owner.
Hierarchies harmonised. Customer, product and geography hierarchies are aligned across the group, so group-level analysis runs on one structure.
Certification built into the month. Reports and datasets follow a formal certification and release cycle, with component sign-off recorded in Azure DevOps, as part of normal monthly operations.
Results
Month-end in days. Automated GR55 onboarding and unified transformations shorten the close and remove its failure points.
More than 80% of data objects shared. Starting with the management reporting layer means most data objects are reused across every other reporting domain.
Ready for the next change. The architecture is designed for future ERP convergence and for onboarding new entities, and the clean, granular history it keeps is the basis for machine-learning forecasting in later phases.
What We Learned
The logic had to be recovered before it could be governed. The people who built the legacy platform had left, and its documentation could not be trusted. The allocation and KPI rules were reconstructed by reverse engineering and from what individual team members knew, and only then rebuilt with owners and version control.
Waiting has a monthly cost. Every month the old model persists, it spends FTE hours on reconciliation, deepens the undocumented logic and postpones the day management can read group performance with confidence.
The strategic lesson: after a merger, the largest data risk tends to sit in the workarounds people normalise until they become the system, which makes governance the core deliverable.

%402x.svg)