From MicroStrategy to Power BI: An Agent Pipeline That Cuts 80% of the Build Effort per Report
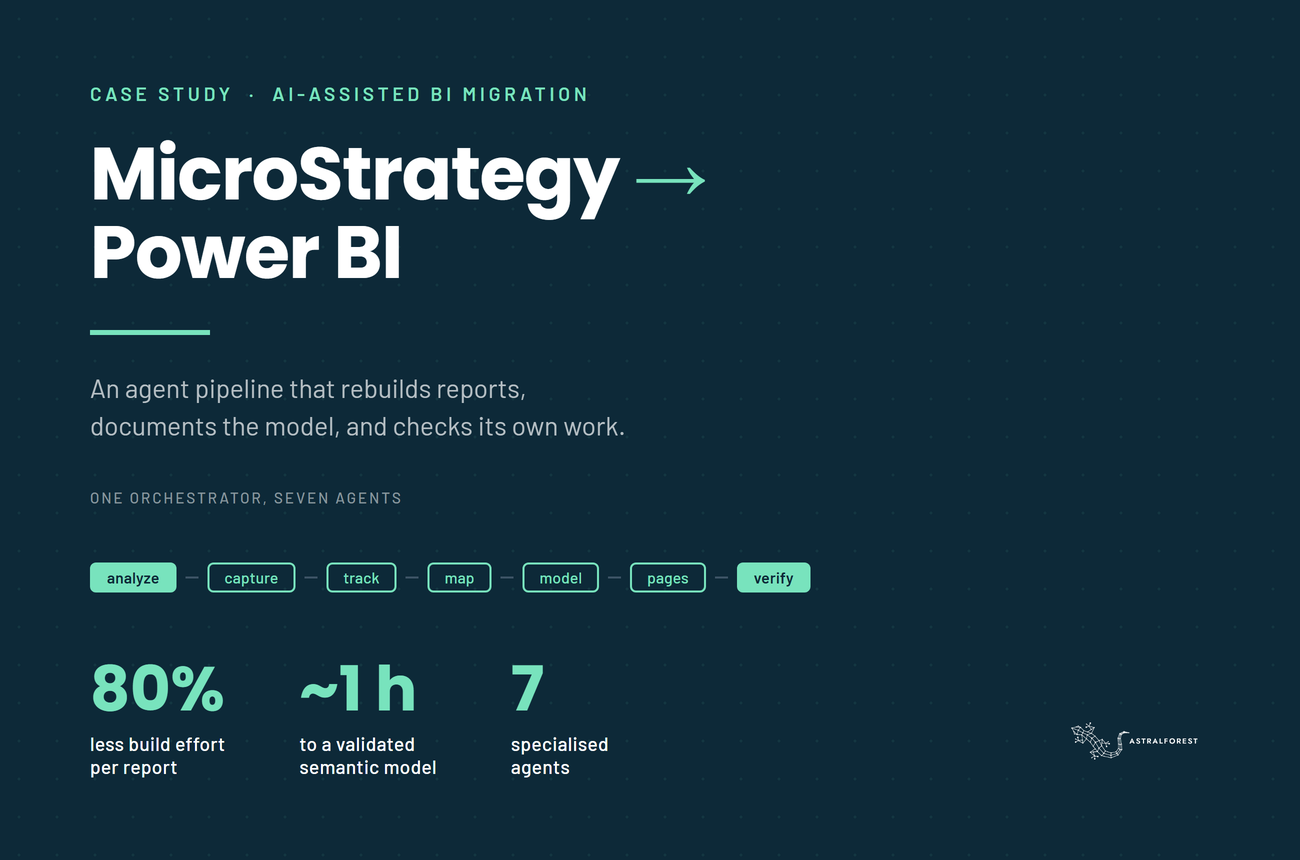
This case study shows how an international online lottery operator beat a MicroStrategy licence deadline by putting seven AI agents to work on its Power BI migration. On simple reports the pipeline removes around 80% of the build effort, measured against 50 reports the same consultant had already migrated by hand.
Executive Summary
An international online lottery operator had given notice on its MicroStrategy licence. In three months the tool would go dark, and 738 reports still had to exist in Power BI. With the migration 40% complete against a plan of 80 to 90%, the existing pace put the deadline out of reach.
We replaced the report-by-report manual build with seven specialised AI agents running under an orchestrator skill. The pipeline takes a report name and returns a documented Power BI semantic model with its report pages built and visually checked against the source. The consultant moved from building models to reviewing them.
Key Outcomes
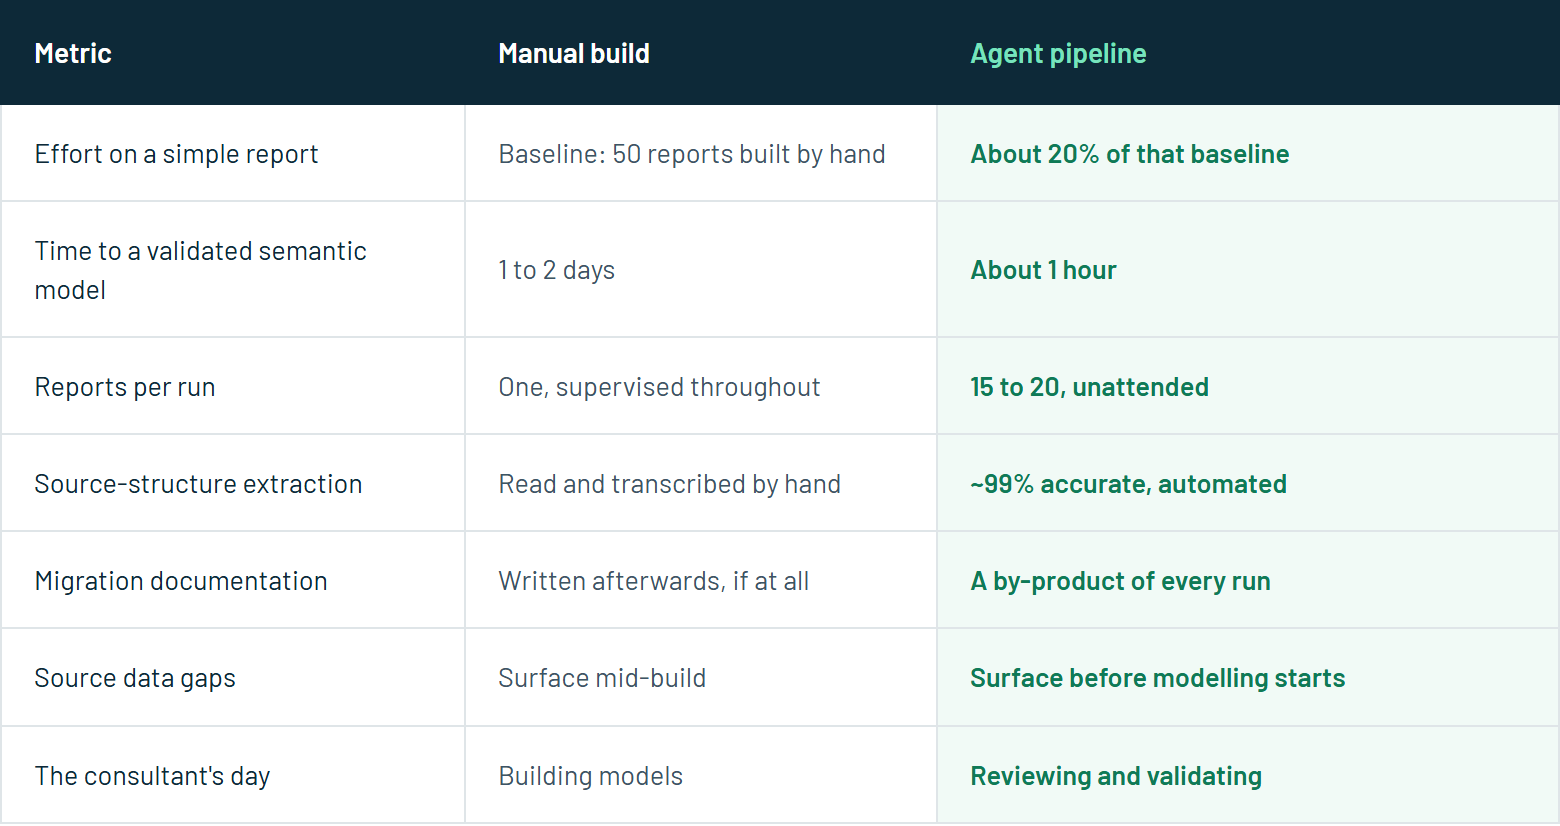
Around 80% of the build effort removed on a simple report, against a baseline of 50 reports the same consultant migrated by hand
Validated semantic model in about 1 hour, down from 1 to 2 days
15 to 20 reports per run instead of one report supervised throughout
~99% accuracy on source-structure extraction, with measure logic read from the MicroStrategy metadata rather than transcribed from a screen
Source data gaps surface before modelling starts, and migration documentation falls out of every run
The Challenge
Astral Forest joined at Discovery, scoping the move from MicroStrategy to Power BI. The brief was explicit from the start: use AI to carry as much of the load as possible, with people supervising. Partway into delivery the constraint hardened, because a licence expiry is not a milestone that can be renegotiated with a steering committee.
The data platform itself stayed as it was. Snowflake keeps its place and only the presentation layer changes, from Snowflake → MicroStrategy to Snowflake → Power BI. The client owns the Snowflake transformations, Astral Forest owns the MicroStrategy analysis and the Power BI build.
Two properties of the estate made automation viable. The reports repeat: tables and basic visuals with slicers, and fairly simple measure logic. And MicroStrategy holds no tabular model to lift across, only large single datasets behind individual reports, so every target model has to be designed from what the report displays. That design work is what took 1 to 2 days per report by hand, and it is the work that does not compress by adding people.
Two things made it harder. The first version of the analysis read reports from screenshots, which reproduce the canvas faithfully and reveal nothing about the logic underneath a metric. And reports were specified against Snowflake views that in several cases did not exist yet, which stops a manual build halfway through and costs a round trip to the client.
The Solution
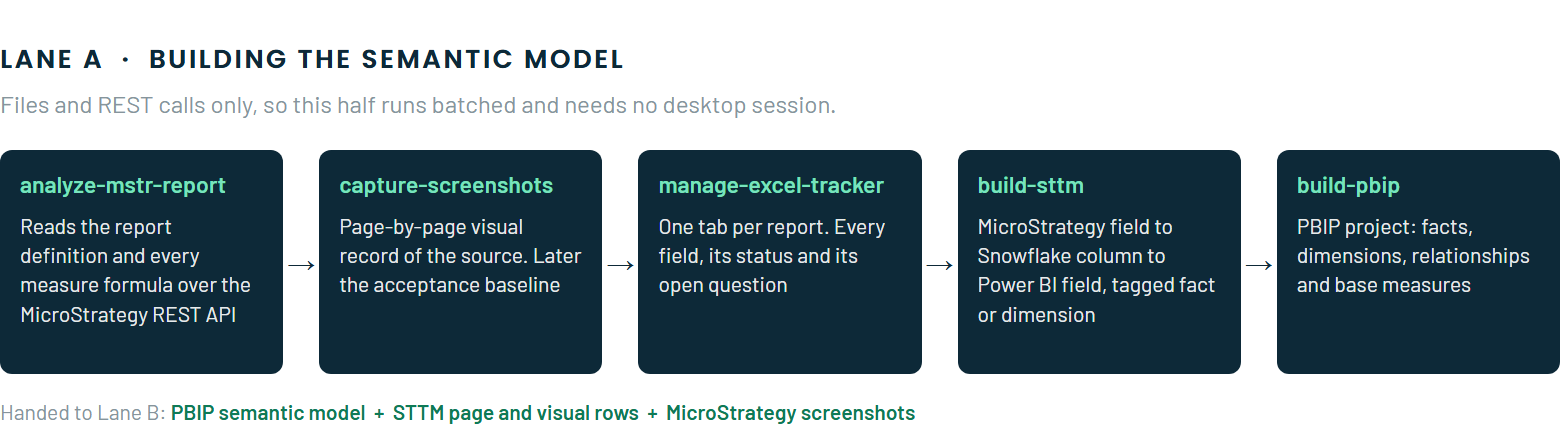
Seven specialised agents run under an orchestrator skill, mstr-to-pbi-migration, which holds the input and output contract of every agent, sequences the run, and reopens an earlier step when a later one finds a gap.
Building the semantic model
The endpoint that changed the most is /api/model/metrics/{id}, which returns each metric's formula as text, a parse tree, or tokens. That gave the agents calculation logic directly from the metadata, which is precisely the thing a screenshot could never supply.
Finishing the report layer
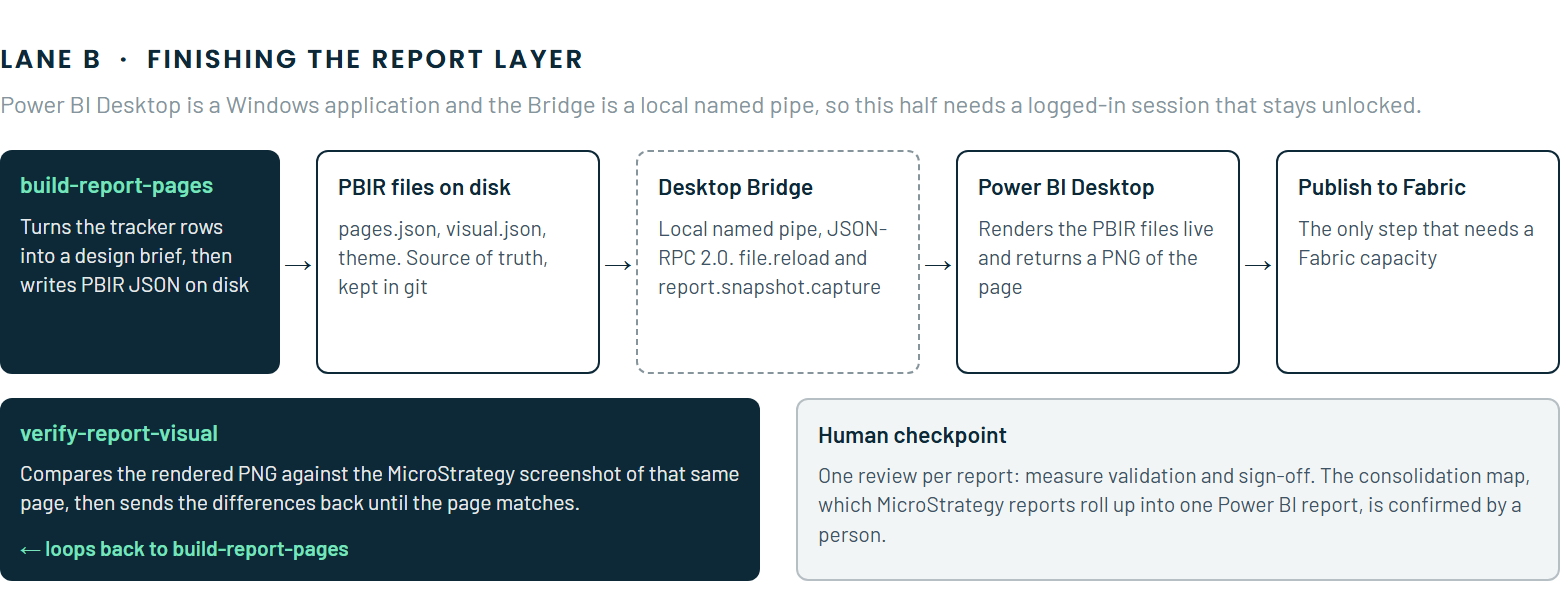
A semantic model is half a migration. What the client opens on Monday morning is a report: pages, visuals, slicers and formatting on the Power BI canvas. Two further agents close that gap.
Microsoft's tooling for Power BI splits the work along the same seam we do. The power-bi-report-authoring skill edits PBIR files, which are the report layer of the very PBIP project our pipeline already produces. The Power BI Desktop Bridge is a local named pipe speaking JSON-RPC 2.0 into a running Power BI Desktop instance, so authoring happens on disk while the Bridge renders the result and hands back a picture of it. A Fabric capacity is needed only at the very end, to publish the finished report into a workspace.
That design makes the screenshots earn their keep twice. capture-screenshots was built to give the client evidence of a source system about to be switched off. In the report layer those same files become the acceptance criterion every rendered page is measured against. A screenshot makes a poor source of semantics and an excellent acceptance test.
How We Built It
Fifty reports by hand came first. The decision that made the automation work was the decision to delay it. Michał Zalewski-Zięba migrated roughly 50 reports manually before writing a single agent instruction. Those reports produced the knowledge the agents now run on, and the assets the pipeline depends on: the source-to-target mapping template, the Excel tracker structure, and an internal Power BI modelling standard now embedded in the model-building agent.
The agents were written during a live migration. Zalewski-Zięba decided how many there should be and where the boundaries fell, ran a real report through the process, and had Claude Code record each step into the appropriate agent as that step was performed. Periodic checkpoints asked whether any agent was carrying too much context. The reports produced during that period were delivered work, so the build cost of the pipeline was absorbed by the migration it was built for.
One artefact stays human. A MicroStrategy estate rarely maps one to one onto Power BI. Several source reports commonly carry the same measures against different slices, and they belong in a single Power BI report with a slicer doing the work those separate reports used to do. The agents propose that grouping from shared Snowflake views and overlapping field sets, and a person confirms it before anything is built. Split a report that should have been merged and the client maintains duplicates for years. Merge two that should have stayed apart and the page buckles under filters that contradict each other.
Gaps now surface early. One Finance report was specified against five Snowflake views, and three of them did not exist. The tracker marked every unresolved field TBC, so we handed the client one precise list while the problem was still cheap to fix, and their team built the views while the pipeline carried on with other reports.
The gain concentrates where the volume sits. On simple reports, which are most of this estate, the pipeline removes roughly 80% of the effort. Reports carrying heavy bespoke logic or unusual layouts stay closer to hand-built and gain less, and they are the minority. At a few dozen reports the effort of building a pipeline is arguable. Across several hundred largely repetitive ones it is settled. The pipeline runs under a flat-rate coding-agent subscription, so volume never converts into a metered token bill.
What We Learned
Automate a process you have already run by hand. The 50 manual migrations were the prerequisite for everything that followed. Automation transfers expertise that already exists, so there has to be expertise to transfer.
Screen capture has a ceiling. Moving analysis onto the MicroStrategy API gave the agents calculation logic directly, and screenshots stayed on as client-facing evidence and as the acceptance test for the report layer.
The orchestrator carries the reliability. Most failures were coordination problems. Making the contracts between agents explicit, and giving one component ownership of them, did more for reliability than tuning any individual prompt. Seven narrow agents with clear inputs and outputs beat one agent with a long brief, and each stays inspectable when a run goes wrong.
Semantic modelling was the clear win. Field mapping and model construction needed the least correction of anything the pipeline does. The visual layer took longer to automate because it needed something the model layer never did: a way to render a page and then look at it.
The pattern carries to any BI migration with a stable data platform underneath, a large volume of structurally similar reports, and a tool change confined to the presentation layer. The same skeleton, analyse the source, capture evidence, track state, map source to target, build the target, holds for migrations off Cognos, Business Objects, Qlik or Tableau. Only the source-analysis agent changes.
The strategic lesson: the migrations that automate well are the ones a team has already run by hand often enough to know where the work actually goes. The 50 reports built the hard way are what made the other 688 cheap.
We are here to answer your questions
Thank you! Your submission has been received!
Oops! Something went wrong while submitting the form.

%402x.svg)